When your costs move faster than your reporting cycle, a monthly close does not give you a blurry picture of your cash position. It gives you a wrong one. A rolling 13-week cash flow forecast, refreshed every week, is how you see a bad week coming while you still have room to do something about it.
What is going on
The middle of 2026 has one defining feature for anyone who runs a business: cost inputs are moving on a schedule set by policy and geopolitics, not by your budget.
Tariffs have made input costs a moving target. Large companies have put numbers on it. Procter and Gamble pointed to roughly a billion dollars in annual tariff impact and raised prices on about a quarter of its products; Constellation Brands flagged a twenty million dollar earnings hit from aluminum tariffs alone. In Thomson Reuters' 2026 Global Trade Report, 72% of trade professionals named tariff volatility the most impactful regulatory change they face, up from 41% a year earlier. Every Federal Reserve Beige Book this year has named uncertainty itself as a defining feature of the environment. The problem is not the level of any one tariff. It is that the level keeps changing, which makes planning around it nearly impossible.
Energy remains a live shock. Crude and refined-product prices have stayed elevated through an on-again, off-again conflict, with the U.S. Strategic Petroleum Reserve at its lowest level since 1983. A national reserve does the same job a company's cash cushion does: it absorbs the first hit so the rest of the system does not feel it immediately. When that buffer is spent, shocks pass straight through.
And the broader signals are softening. The Conference Board's Leading Economic Index slipped in June, reversing two months of small gains, on weakening consumer expectations and a drop in building permits (The Wall Street Journal, July 20, 2026). Bank of America's June read on small businesses found cost pressures, elevated fuel among them, outrunning revenue growth, with the smallest firms hit hardest on their margins. The pressure is showing up first in cash.
Put those together and a cost increase that used to arrive once a year now arrives on a Monday, and it arrives in cash before it arrives anywhere else on your financial statements.
Why this raises the stakes on cash
A large company can hedge fuel, hold pricing power with suppliers, and lean on its balance sheet to ride out a bad quarter. A thinner-margin business gets the cost increase immediately and cannot reprice until its next contract renewal, if it has the leverage to reprice at all. So the pressure lands in working capital and liquidity long before it lands in the annual results.
Here is the mechanical reason a monthly close does not catch it. Your month-end close takes two to three weeks to finalize. In a stable environment that lag is a minor annoyance. In an environment where a key commodity can move double digits in a single week, that lag is the difference between adjusting your pricing this week, and discovering next month that the margin is already gone.
It is a sampling-rate problem. If the thing you are measuring moves faster than how often you measure it, you do not get a fuzzy version of the trend. You get the wrong answer.
The fix is not more precision. It is measuring more often.
What a 13-week cash flow forecast actually is
Most forecasting is built on accrual accounting: projections of revenue, EBITDA, and net income across monthly, quarterly, and annual plans. That work answers whether the business is profitable over time. A 13-week cash flow forecast answers a different question: will there be enough cash in the bank, each week, for the next quarter?
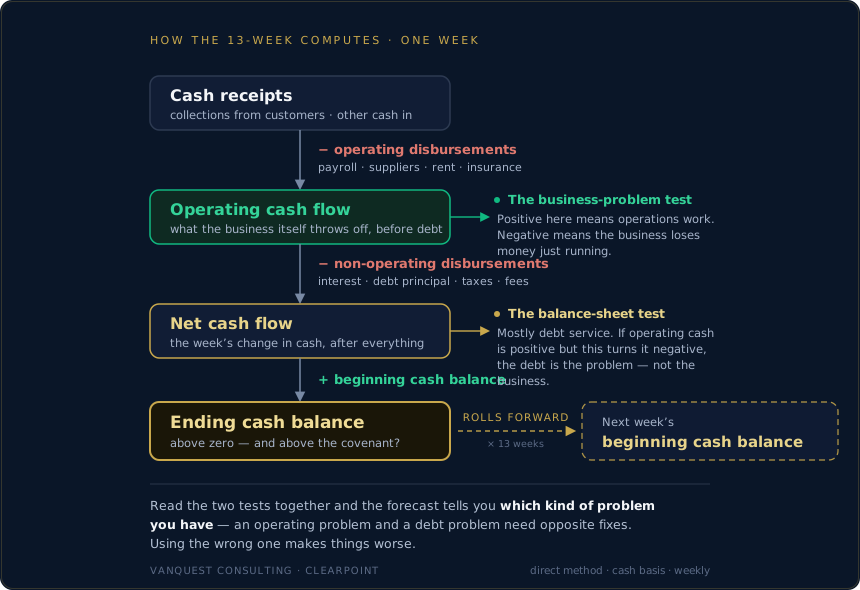
It is a short-term, weekly, cash-basis view. It forecasts actual cash receipts and actual cash disbursements, week by week, rather than deriving cash from an income statement. The structure is deliberately simple: cash receipts for the week, less operating disbursements like payroll and suppliers, less non-operating disbursements like interest and taxes, equals net cash flow; add the beginning balance and you have the ending balance, which starts the next week. Run that across thirteen weeks and you can see the full trajectory: which weeks are tight, which week the balance dips lowest, and whether it threatens to run past zero or breach a covenant.
Two features make it a management tool rather than a static report. It is weekly, which is frequent enough to catch a cost shock inside the window where you can still respond. And it is rolling: every week you drop the week that just passed, add a new week out at the far end, and compare what actually came in against what you forecast. That comparison, week after week, is where the discipline and the credibility come from.
What it tells you
A well-built forecast is diagnostic. It answers the questions that actually drive decisions:
- Is there an immediate cash problem, and when? Not "are we profitable," but which week the balance gets uncomfortable.
- If we need cash, how much and by when? The forecast sizes the gap precisely. This is exactly the number a lender wants before extending credit and a board wants before it approves anything.
- Is this a business problem or a balance-sheet problem, or both? The most consequential question here, expanded just below.
- Where is working capital trapped? In receivables that collect too slowly, inventory that sits too long, or payment terms tighter than they need to be.
- Which levers can we actually pull, and what does each buy us?
The distinction that decides everything: business problem or balance-sheet problem
More than any single number, this is the judgment the forecast exists to inform. Getting it wrong is how viable companies get destroyed.
A business problem is an operating one. The company does not make enough from what it does: margins are too thin, costs too high, or revenue is falling, so it burns cash simply running. A balance-sheet problem is a capital-structure one. The operations are sound and generate cash, but there is too much debt for that cash to service. From the outside the two look identical, because both surface the same way: "we are running out of cash." But they call for opposite remedies. An operating problem needs operational change: cut costs, reprice, exit unprofitable lines. A balance-sheet problem needs a financial fix: restructure or refinance the debt, extend maturities, convert some of it to equity.
Apply the wrong remedy and you make it worse. Cost-cutting a company that actually has a debt problem starves a fundamentally sound business, hollowing out the operations that could have serviced the debt after a restructuring. Refinancing a company that actually has an operating problem just resets the clock on the same failure, now with fresh fees and a shorter runway.
The 13-week separates the two mechanically, which is why it is the right tool for the question. Look at operating cash flow, before debt service. If it is positive but the ending balance still runs negative once interest and principal are paid, the debt is the problem, not the business. If operating cash flow is negative on its own, the business is the problem, and no amount of debt restructuring fixes a company that loses money running normally. Frequently it is both, and the forecast shows the mix, which tells you the sequence: stabilize operations far enough to make a debt restructuring credible, then restructure. Reversing that order wastes the one thing a distressed company has least of, which is time.
How it helps: turning visibility into options
Seeing the problem is only half of it. The forecast is where you test the fixes before you commit. Operational levers include accelerating collections, managing payroll timing, extending supplier terms to create float, converting slow inventory to cash, and selling non-core assets. Financial levers include drawing on a revolver sized to the gap, opening a constructive conversation with creditors backed by real numbers, timing debt payments deliberately, and evaluating strategic alternatives from a position of information rather than panic.
Beyond the individual levers, the forecast does three things that compound. It imposes discipline, because a weekly cash number everyone can see changes how spending decisions get made. It creates transparency, and when a lender or investor can see a credible, regularly updated cash picture, their confidence goes up, which is often what keeps a deal or a credit line alive. And it buys back options.
The company that reacts late does not just pay more. It runs out of choices.
The company that sees a shortfall eight weeks out can negotiate, reprice, and plan calmly. The company that discovers the same shortfall the week it arrives is left with only the expensive, forced moves. And the value is highest well before any crisis, when there is still time to build the forecast calmly and use it to preserve choices. Built under duress it still works, but the options it can protect have already narrowed.
What it looks like in practice
These patterns are not hypothetical. Two composites, drawn from how these situations typically unfold, make the point.
A food manufacturer facing a liquidity crisis had roughly a ten-week runway and no committed source of new funding. The timeline to build a working cash model was compressed to under a week, precisely because the company had never kept one. The model's job was to establish exactly how long the runway was, size the funding injection needed to bridge it, and let management toggle between how they were actually paying bills and how they would pay on normal terms. Without it, there was no credible basis to ask investors for anything.
In a separate reorganization, the forecast did three things at once: the data clarified where the cash pressure points were and sized the financing required, the transparency raised the confidence of the party bidding to buy the business, and together those turned what could have been a liquidation into a bridge to a sale. Even a fundamentally viable business can end up liquidated for lack of a credible, forecast-backed plan.
The lesson in both is the same. The value of the forecast is highest well before the crisis, when there is still time to build it calmly and use it to preserve choices. Built under duress it still works, but the options it can protect have already narrowed.
Why now
None of this is new. The 13-week cash flow forecast has been the foundational tool of restructuring and treasury management for decades. What has changed is the environment. When input costs were stable, monthly reporting was good enough for most healthy companies, and the weekly forecast was a tool you reached for only in distress. That is no longer true. When tariffs reprice your inputs unpredictably, when energy passes straight through a spent buffer, and when the leading indicators are drifting down, the gap between how fast your costs move and how often you look at your cash has widened for everyone, not just for companies already in trouble.
A rolling 13-week forecast does not fix the Strait of Hormuz or repeal a tariff. It does something narrower and more useful: it shows you which week the cost increase actually lands in your bank account, while you still have room to act on it.
See it work on your numbers
VanQuest delivers institutional-quality cash flow analytics to companies that could not previously access it. Our ClearPoint platform turns a rolling 13-week forecast into a live model: move a driver, and the trajectory, the liquidity position, and the covenant headroom recompute on the spot. It was built by Baber Khan, CFA, who spent two decades in restructuring and M&A advisory before rebuilding the model that every one of those engagements depended on.
Start a conversationThis article is general information, not financial, legal, or investment advice. Figures cited are attributed to their sources and were current as of July 2026.