Watch · 12 seconds
Four seconds to find the pattern. Then it shows you.
The late payments were always in your invoice history, buried among hundreds of others. A rolling 13-week cash flow forecast is your early warning system.
Practical analysis on cash flow, liquidity, and financial strategy for companies in transition — and the lenders, boards, and advisors who back them.
The late payments were always in your invoice history, buried among hundreds of others. A rolling 13-week cash flow forecast is your early warning system.

Three-quarters of first-quarter growth came from AI capital spending. That one engine is now wired, through the dollar and the yen, to the long-term interest rate that discounts it. One line on the Federal Reserve's weekly balance sheet tells you when the wire gets cut.
Read the full piece →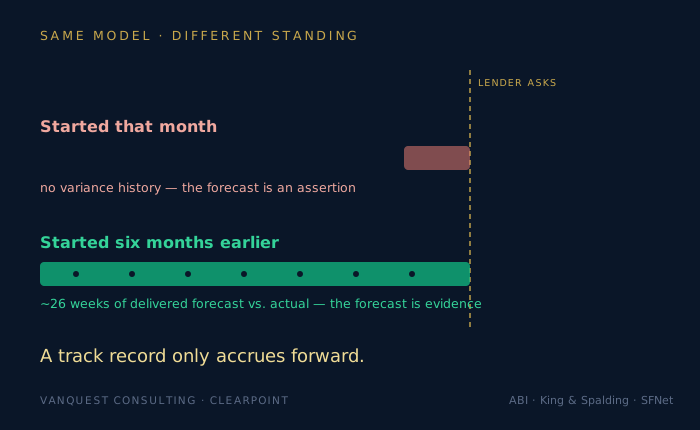
Every cash collateral and DIP financing order runs on a 13-week budget. It is the one financial artifact whose value depends on when you started it — which is why it belongs in place long before a lender ever asks.
Read the full piece →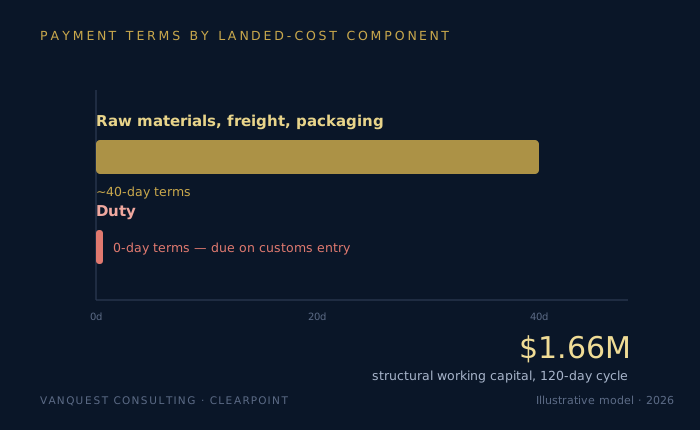
Every other cost in your landed-cost stack comes with payment terms. Duty doesn't. That zero-day term quietly compresses your blended payables and locks up working capital a monthly forecast never catches.
Read the full piece →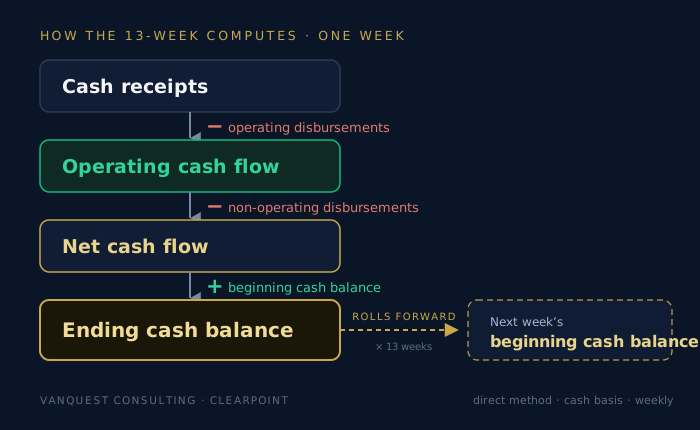
When your costs move faster than your reporting cycle, a monthly close does not give you a blurry picture of your cash position — it gives you a wrong one. What the tool is, what it tells you, and why the case for keeping one has strengthened in 2026.
Read the full piece →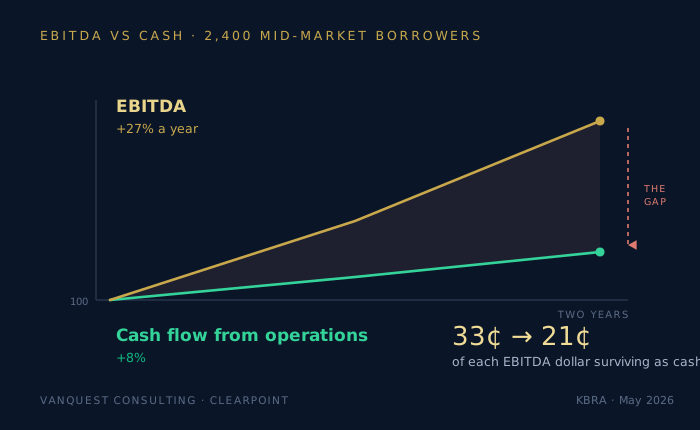
Across more than 2,400 middle-market borrowers, EBITDA grew at a 27% compound annual rate over two years while cash flow from operations grew 8%. If you lend on a cash-flow basis, neither leverage nor fixed charge coverage will show you that.
Read the full piece →If a cost shock, a lender conversation, or a covenant is on your mind, let's talk it through.